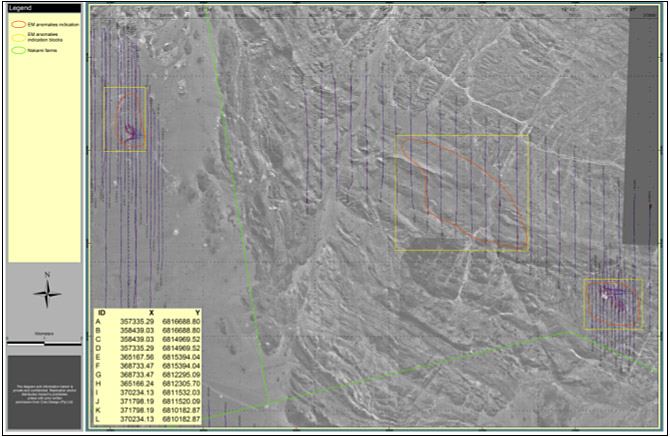
Example of the data generated by the
EM surveying: target areas show spikes in the data and indicate areas
of possible high resistivity/low conductivity or vice versa. These areas
were further explored and confined, thus greatly assisting the exploration
phase.