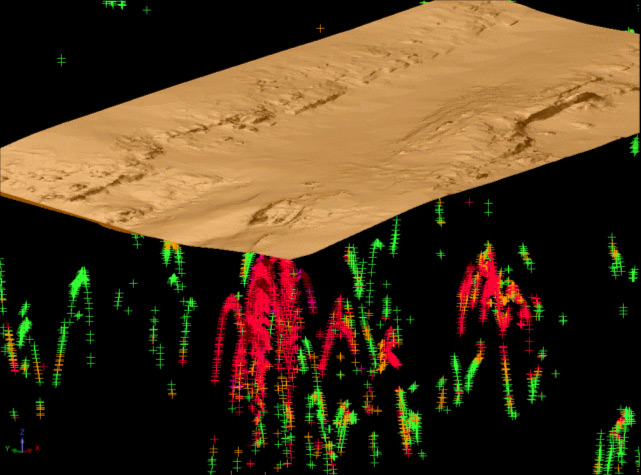
Fig O1.
DTM overlain onto electro-magnetic survey results, showing areas where anomalies are present. Red indicates high readings and therefore target areas.